 Nileva

Shopify B2B reports answer one question a blended store keeps asking: how is the wholesale side doing on its own? This guide covers the three ways to see wholesale sales on Shopify, what each one counts and leaves out, and how to read what your trade discounts cost you, with a worked example you can repeat with your own figures.
Key takeaways
- Shopify's own B2B reports are explorations built on "Is B2B order", grouped by company and company location or split from direct sales by month; the Help Center page doesn't define which orders count as B2B.
- If you price wholesale by customer tag, the app tags each B2B order
nileva-b2b, so you can list every one in Orders withtag:nileva-b2b OR tag:orb2b-b2b. - The app's Analytics page, on every plan including Free, reports B2B net sales, orders, buyers, and what your B2B pricing cost per customer group, read from Shopify's own sales reports.
- Margins come from Shopify's profit reports and the cost per item on your products; the app shows no cost, profit or margin.
Why wholesale and retail sales need separate reports
A trade order and a retail order look alike in a store's totals, but they behave differently. The trade buyer pays a lower price, usually buys more units at once, and may pay later on terms. Blend the two and the numbers start to mislead you.
Say your total sales grow. That could be retail doing well, or one large trade account placing a bigger order at a deep discount. The total doesn't tell you which, and the two call for different decisions. Average order value is worse still: a few large wholesale orders lift it while retail stays flat.
The question a wholesale report must answer is narrower than "how much did we sell". It is: which trade buyers bring the revenue, is that revenue growing, and how much did their lower prices give away to get it. The rest of this guide shows where each of those answers lives.
Shopify's native B2B reports
Shopify's Help Center shows how to build a B2B report yourself, as a custom exploration in Shopify Analytics (Shopify Help Center: B2B reports). The page gives two examples.
Top B2B customers and locations
- In Shopify admin, go to Analytics > Reports and click New exploration.
- Under Metrics, add Net sales.
- Under Dimensions, add Company name, then Company location name.
- Under Filters, set Date range to Last 12 months and click Apply. Then add the filter Is B2B order and set it to Yes.
- Click Save and name the report.
The page says the Is B2B order filter "removes all non-B2B orders from your data". Its other example, the first one on the page, splits sales into B2B and direct-to-consumer: add Is B2B order and Month as dimensions instead of a filter, and you get the two side by side month by month. Each example also comes as a ShopifyQL query you can paste into the exploration's query editor.
What the Help Center page doesn't say
The page doesn't define which orders Shopify marks as B2B, and it names no plan. The top-customers example also groups by Shopify's company records, so it is built for stores that sell through Shopify's own companies and catalogs, which our guide to B2B on Shopify without Plus walks through.
If you price wholesale by customer tag instead, don't assume either way that your trade orders are in the "Yes" bucket. Check it: run the B2B-versus-direct exploration for a single day on which you know your wholesale orders, and compare the B2B figure with those orders.
Wholesale reports when you price by customer tag
Many stores never set up Shopify companies. They tag trade customers, group them into tiers, and price by tag with an app. For them, the order tag is the most direct way to see wholesale orders.
When an order is created, the app tags it nileva-b2b if any one of these is true (Analytics overview):
- the buyer is a contact of one of your Companies in the app;
- the buyer carries the tag of one of your Customer Groups;
- the buyer carries a customer tag that an active wholesale or volume pricing rule targets;
- the app's B2B pricing discounted the order.
Tags match as a whole tag, and case doesn't matter: a group tag gold does not match a customer tagged goldsmith. Orders placed before the app renamed its tags carry the older orb2b-b2b. To list every B2B order, old and new, go to Orders and search for tag:nileva-b2b OR tag:orb2b-b2b. The app also adds nileva-priced (older orb2b-priced) when its pricing applied to the order.
If you use a Shopify Flow workflow, a saved Orders view or an integration that filters only on orb2b-b2b, update it to match both spellings. New orders carry only nileva-b2b, so a filter on the old tag misses everything placed since the rename.
Watch the fourth condition. A rule that targets all customers, logged-in customers or guest visitors discounts shoppers who carry no trade tag, and every order it discounts counts as B2B. In a store that also sells retail, aim trade rules at a customer tag or group so retail orders stay out of the B2B figures. Targeting a tag or group needs the Essential plan or above: on Free, a rule can only target all customers, logged-in customers or guest visitors, so every order it discounts is reported as B2B. Our guide to wholesale and retail in one store covers that setup.
Shopify B2B reports in the app's Analytics
A tagged order list tells you which orders were wholesale, but not how the trade side adds up. For that, Nileva B2B Wholesale Pricing has an Analytics page under Orders → Analytics, on every plan including Free, with CSV export. Every figure is read from Shopify's own sales reports; in the docs' words, "the app does not add up, convert or average any of the numbers itself".
The page reports on orders tagged nileva-b2b or orb2b-b2b. It doesn't count orders placed before you installed the app, which were never tagged, test orders, which Shopify leaves out of its reports, or retail orders.
A toolbar sets every figure on the page: Date range (Today, Yesterday, Last 7, 30 or 90 days, Last 12 months, Month to date, Year to date or Custom; Last 30 days by default), Compare (Previous period, Previous year or No comparison), and Currency, which appears only when your store sells in more than one. Shopify converts each order at the rate on that order, so converted figures show value, not the exact cash received.
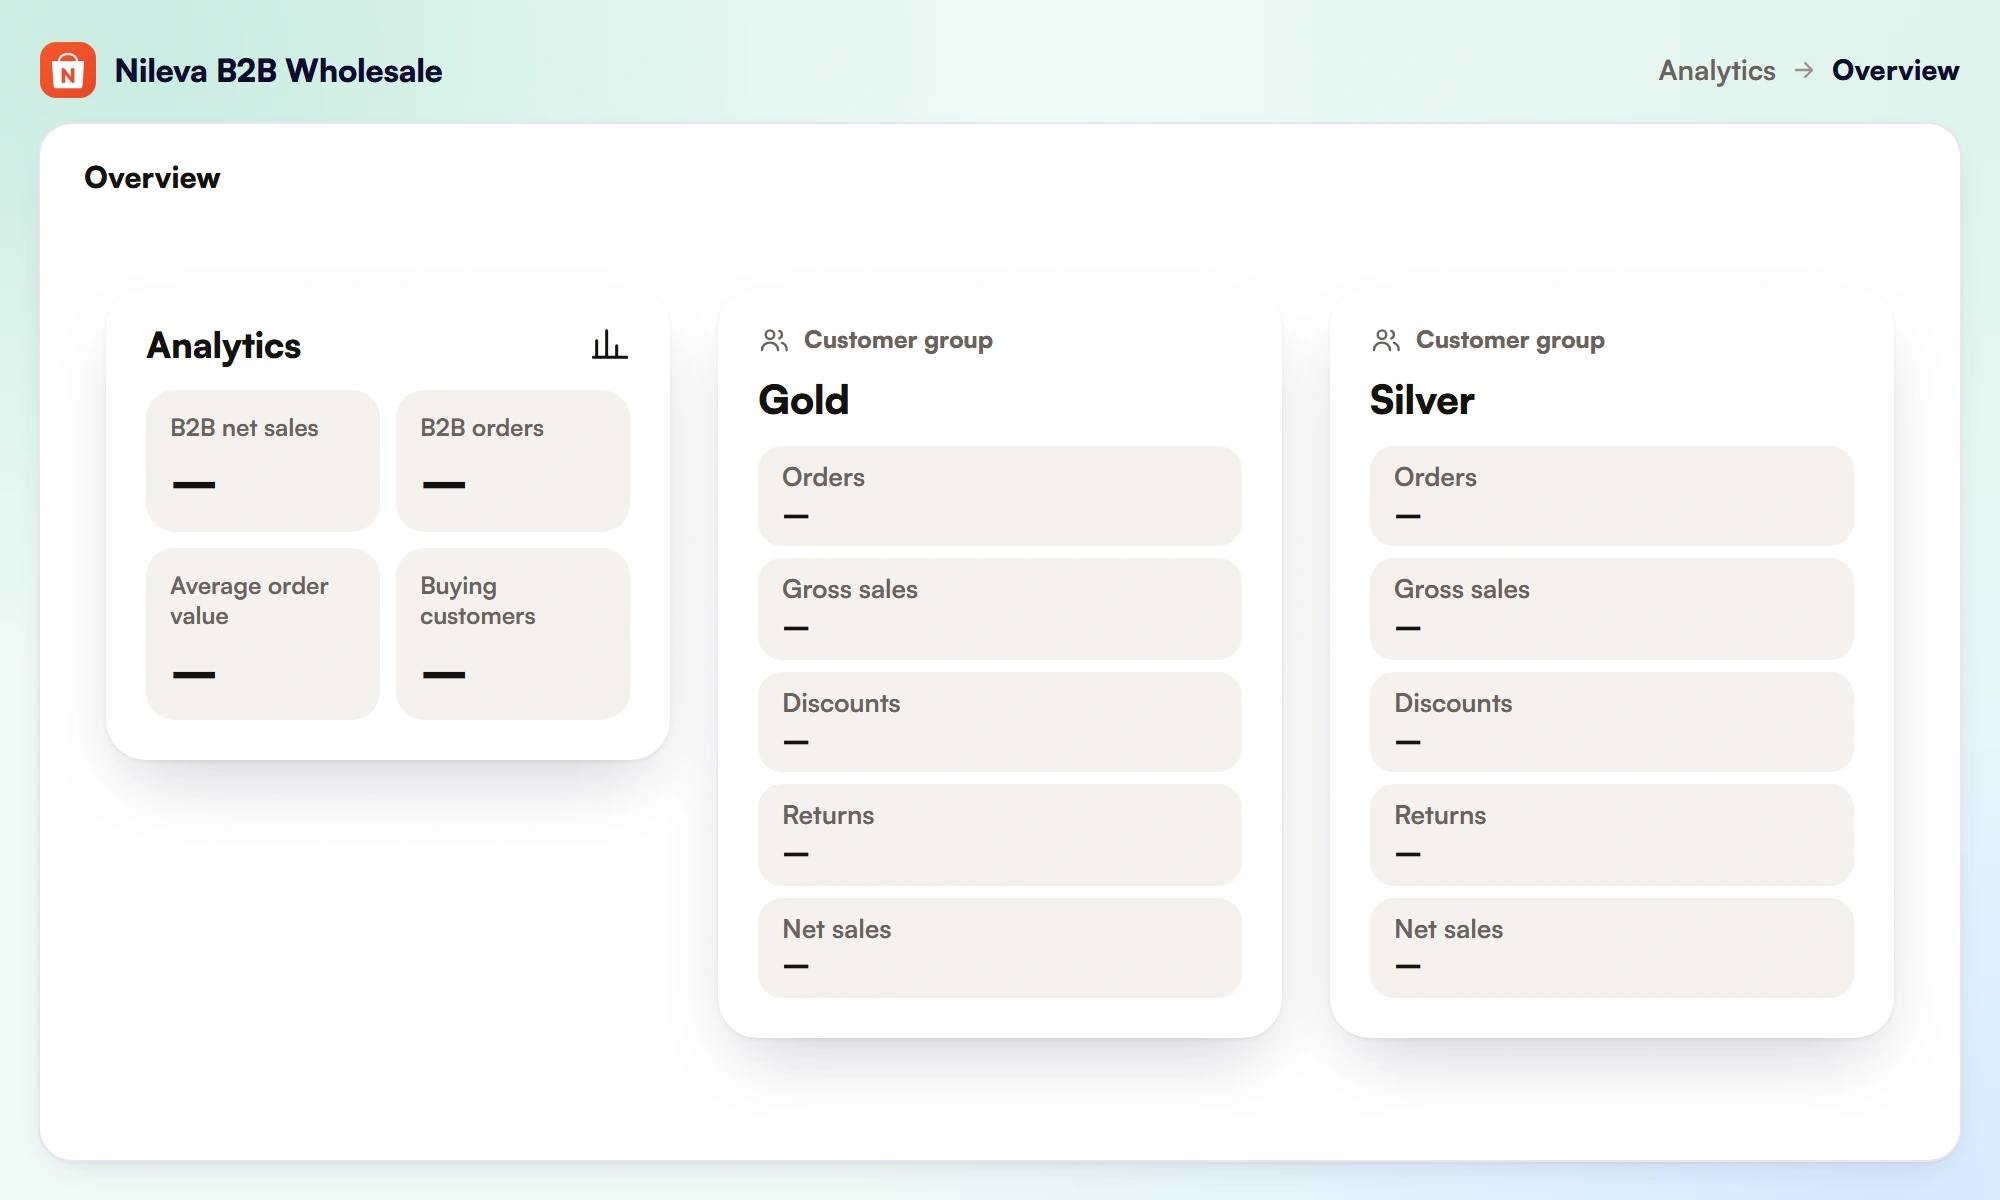
The four numbers at the top
- B2B net sales: B2B sales after discounts and returns, without taxes, shipping, duties and fees, so it won't match the order totals you see in Shopify.
- B2B orders: each order counts once, however many items it has.
- Average order value: Shopify's figure, calculated before later changes such as returns, so it may not equal net sales divided by orders.
- Buying customers: different customers who placed a B2B order; three orders from one buyer count once.
Each tile shows Shopify's percentage change against the comparison period. Below the tiles, a bar chart shows B2B net sales over time, one bar per hour, day, week or month depending on the range.
Who is buying
This table splits B2B sales three ways, with the columns Orders, Net sales and Avg order, 10 rows a page, highest net sales first:
- Customers: one row per customer, by name.
- Customer groups: one row per group, labelled by the customer's tags. A tag that a pricing rule targets without a group shows as the tag with "matched by customer tag"; a customer in two groups shows as both names joined, such as "Gold + Silver". Labels follow your groups as they are now, so renaming a group renames its row.
- Companies: one row per company as recorded on the order in Shopify. The button appears once you have created a company in the app.
That last view needs a word of care. It groups by the company Shopify holds on the order, and the app's own Companies are records inside the app, not Shopify companies: the app doesn't write them onto the order. So orders from contacts of the app's Companies show as Unknown there, like any order with no company recorded in Shopify; only orders placed through Shopify's own companies get a company name. To see your trade tiers side by side, use Customer groups. How the app's companies and their tiers work is in our guide to Shopify B2B company accounts.
What your B2B pricing cost you
The second table shows, by customer group, what your B2B pricing gave away: Orders, Gross sales, Discounts, Returns and Net sales. Discounts and returns appear without a minus sign and come straight from Shopify.
This table selects orders differently from the rest of the page. It counts every order that carries the app's wholesale or volume pricing discount, at checkout or on a draft order the app priced, and ignores the B2B tag. So its order count can differ from B2B orders: a trade buyer who paid full price is in the tiles but not here, and a discounted order that missed the tag is here only.
Reading the cost of a wholesale tier
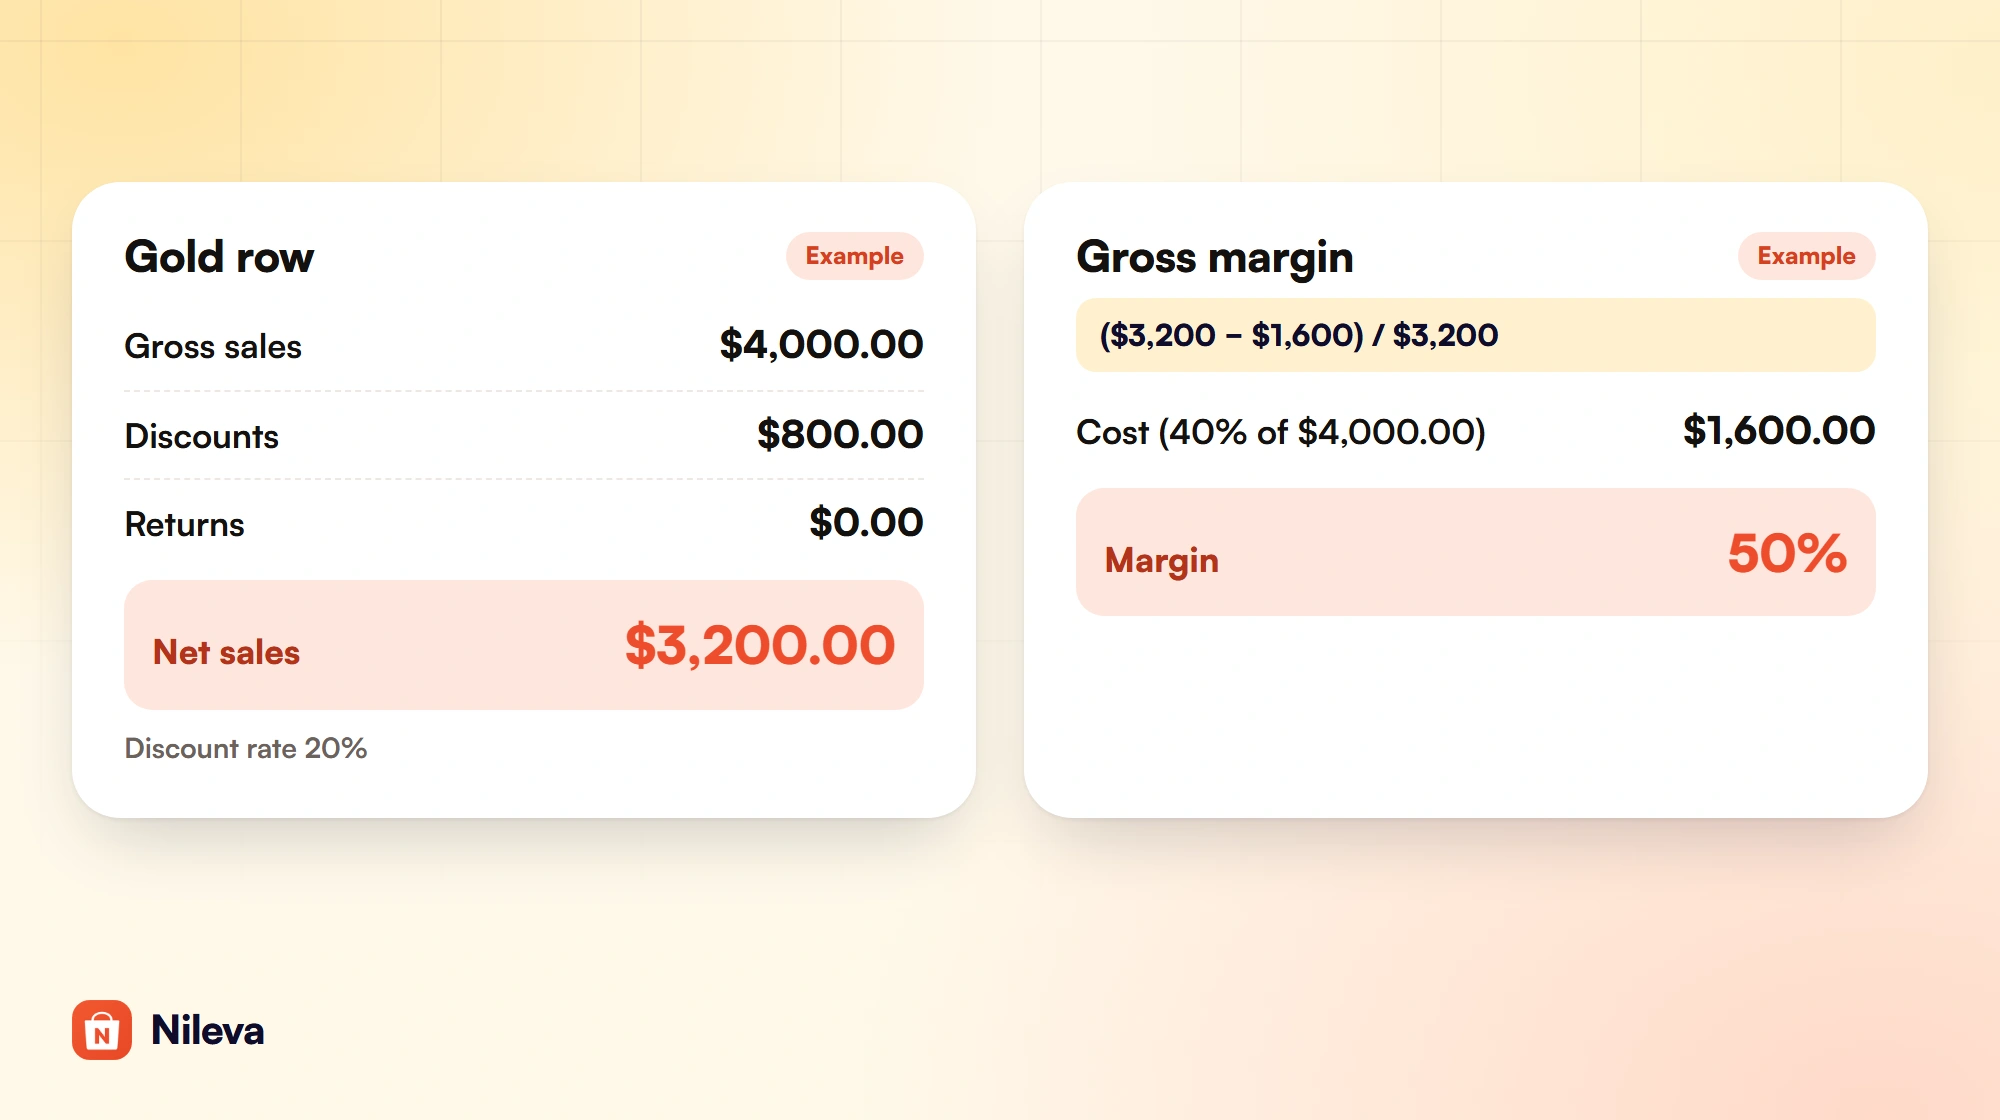
The cost table's best use is one division and one subtraction. Take one row and read it the way the example below does. The figures are invented for the example.
| Column | Example value | What it tells you |
|---|---|---|
| Gross sales | $4,000.00 | What the Gold group's orders were worth before any discount |
| Discounts | $800.00 | $800 ÷ $4,000 = 20% of gross went to the group's pricing |
| Returns | $0.00 | Nothing refunded or returned in the range |
| Net sales | $4,000 − $800 − $0 = $3,200.00 | What the group brought in |
| Gross margin, cost $1,600.00 | ($3,200 − $1,600) ÷ $3,200 = 50% | What is left of each sales dollar after the cost of goods |
Example: the Gold group is meant to get 20% off, and the row confirms the group received 20% on average. If the rate you read differs from the tier, trust the row: it is what Shopify recorded for the group's orders. Use the rate from the row, not the one in the rule.
The table has no cost column. For the margin, enter a cost per item on each product: Shopify then shows the margin as ([price − cost] ÷ price) × 100 on the product (Shopify Help Center: cost per item). In the example every product costs 40% of its retail price, so the group's goods cost 40% × $4,000 = $1,600. Sold at retail, the same goods would have left $4,000 − $1,600 = $2,400 of gross profit, a 60% margin. The Gold price leaves $1,600, a 50% margin: the $800 of discounts came straight out of gross profit.
That estimate holds only when your products have similar cost ratios. For the exact figure, Shopify's profit reports compute gross margin as ([net sales − cost] ÷ net sales) × 100, with discounts and refunds included, for products that had a cost recorded when they sold (Shopify Help Center: profit reports). Shopify records the cost per item on the order when the order is created, so a cost you add or change today doesn't reach past orders (Shopify Help Center: cost per item). Enter costs before the period you want to measure.
How fast the margin falls per tier
Extend the same arithmetic to a ladder of example tiers, with a cost of 40% of the retail price, per $100 of sales at retail price:
| Example tier | Net sales | Cost | Gross profit | Gross margin |
|---|---|---|---|---|
| Retail, no discount | $100.00 | $40.00 | $60.00 | 60.0% |
| Bronze, 5% off | $95.00 | $40.00 | $55.00 | 57.9% |
| Silver, 10% off | $90.00 | $40.00 | $50.00 | 55.6% |
| Gold, 20% off | $80.00 | $40.00 | $40.00 | 50.0% |
| Diamond, 30% off | $70.00 | $40.00 | $30.00 | 42.9% |
Each point of discount removes $1 of gross profit per $100, because the cost doesn't move. In relative terms the steps grow: moving a buyer from Gold to Diamond cuts gross profit per $100 from $40 to $30, so that buyer must buy $40 ÷ $30 = 1.33 times as much, a third more, just to leave you the same profit. Before you promote a buyer, ask whether a third more volume is realistic; afterwards, set the date range to a period before the move and then one after it, and compare the buyer's net sales in the Customers view. That table has no comparison column, so you read the two ranges one after the other. To set the tiers in the first place, see our Shopify wholesale pricing guide, the guide to a price per customer tier and how to calculate a wholesale price that keeps your margin.
Three ways to see wholesale sales, compared
| Way | What it counts | Breaks down by | Where |
|---|---|---|---|
| Shopify exploration with "Is B2B order" | Orders Shopify marks as B2B (not defined on the Help Center page) | Company name and company location, or month in the B2B-versus-direct example | Analytics > Reports > New exploration |
| Orders list searched by tag | Orders the app tagged nileva-b2b, plus older orb2b-b2b | Nothing: a list of orders | Orders, search tag:nileva-b2b OR tag:orb2b-b2b |
| The app's Analytics | Orders tagged B2B; the cost table counts orders the app's pricing applied to | Customer, customer group, or the company recorded in Shopify | Orders → Analytics in the app, every plan |
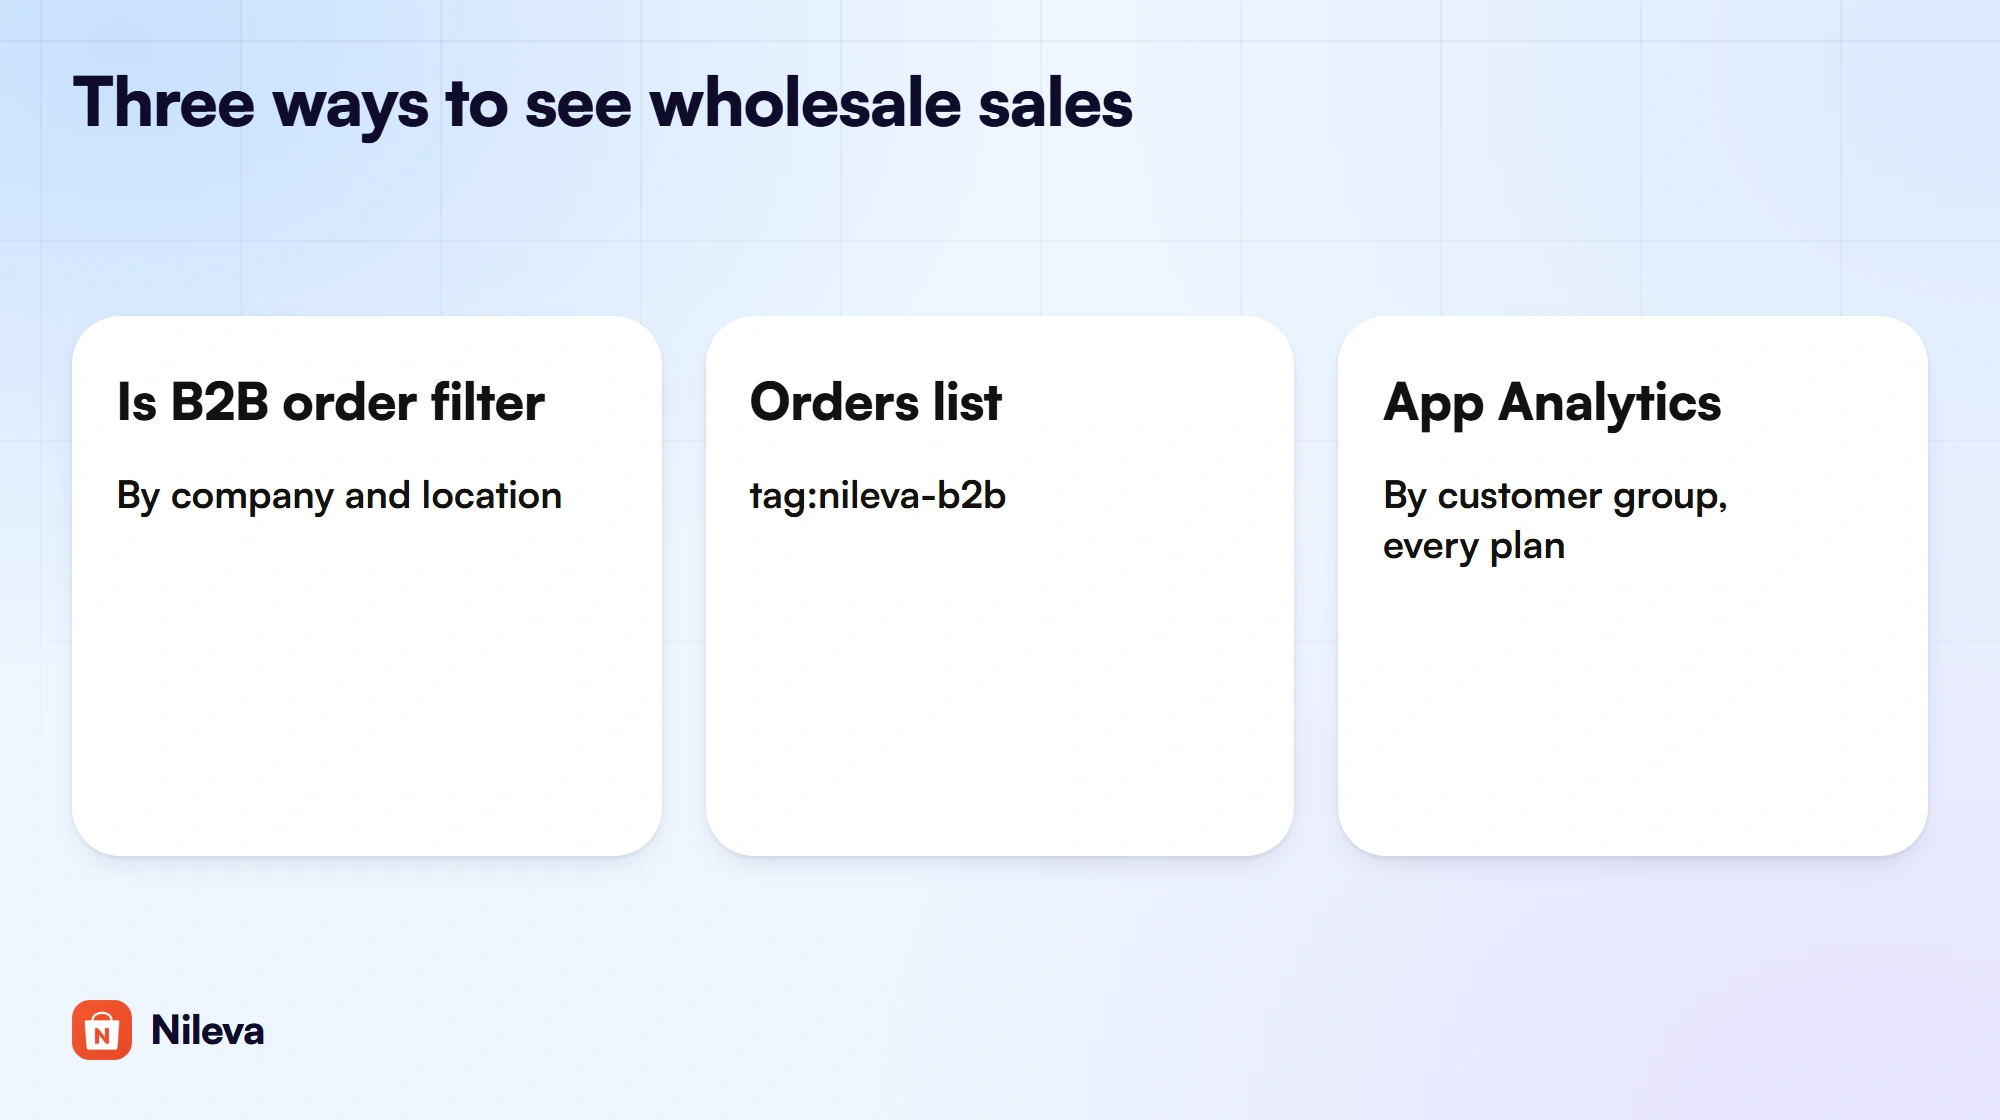
These three kinds of Shopify B2B reports aren't rivals. A store on Shopify's companies gets the most from the exploration. A store that prices by tag uses the order list to open single orders and Analytics to see totals and the cost of each tier. The CSV export holds three blocks (Summary, Who is buying and the cost table) for what is on screen; the file doesn't name the currency, and it lists discounts as negative numbers.
Common reasons an order is missing
The app's Analytics troubleshooting page lists the checks in this order:
- It was a test order. Shopify leaves orders paid through a test payment gateway out of its reports.
- It was placed before you installed the app. Older orders were never tagged.
- It has no B2B tag. Search Orders for
tag:nileva-b2b OR tag:orb2b-b2b. If it isn't there, it most likely met none of the four conditions when it was placed. An order the app's pricing discounted still shows in the cost table, tag or not. - The customer was tagged after ordering. Whether an order is B2B is decided when it is placed; adding a buyer to a group later doesn't change earlier orders.
- The range or timing is off. Check the date range, and give a brand-new order a minute: the page reuses figures it read within the last minute.
If the page shows Reconnect the app to see your analytics instead of figures, your store installed the app before Analytics existed. Open the app from your Shopify admin and approve the new permission. The banner never stands for zero sales, and Export CSV stays greyed out until you approve.
Frequently asked questions
Does Shopify have B2B reports?
Yes. Shopify's Help Center shows how to build Shopify B2B reports as custom explorations, filtered on "Is B2B order" and grouped by company name and company location name, or split into B2B and direct sales by month.
How do I see wholesale orders if I price by customer tag?
Search Orders for the app's tag, tag:nileva-b2b OR tag:orb2b-b2b, to list every B2B order, or open Orders → Analytics in the app for totals by customer and customer group.
Is the app's Analytics on the Free plan?
Yes. Analytics, including CSV export, is on every plan. Stores that installed the app before Analytics existed approve one extra permission first.
Why does the cost table show a different number of orders?
It counts orders the app's pricing applied to, not orders with the B2B tag. A trade buyer who paid full price is in the B2B orders tile but not in the cost table.
Can I see the margin on wholesale orders?
Not in the app, which shows no cost or margin. Add a cost per item to your products, and Shopify's profit reports show gross margin after discounts for products that had a cost when they sold.
Try it
See what your wholesale buyers bring in and what their prices cost you, on every plan.


